
Visual Design, UX Research, UI Design
Curious Boston
Introduction
By the end of this case study, you’ll see how three other senior-year undergraduate students and I conducted extensive qualitative research on the open data needs of community & advocacy organizations throughout Boston, and how we translated the outputs of this research into an award-winning information visualization and solutioned a high-fidelity prototype based on user needs.
Challenge
Project background & challenge
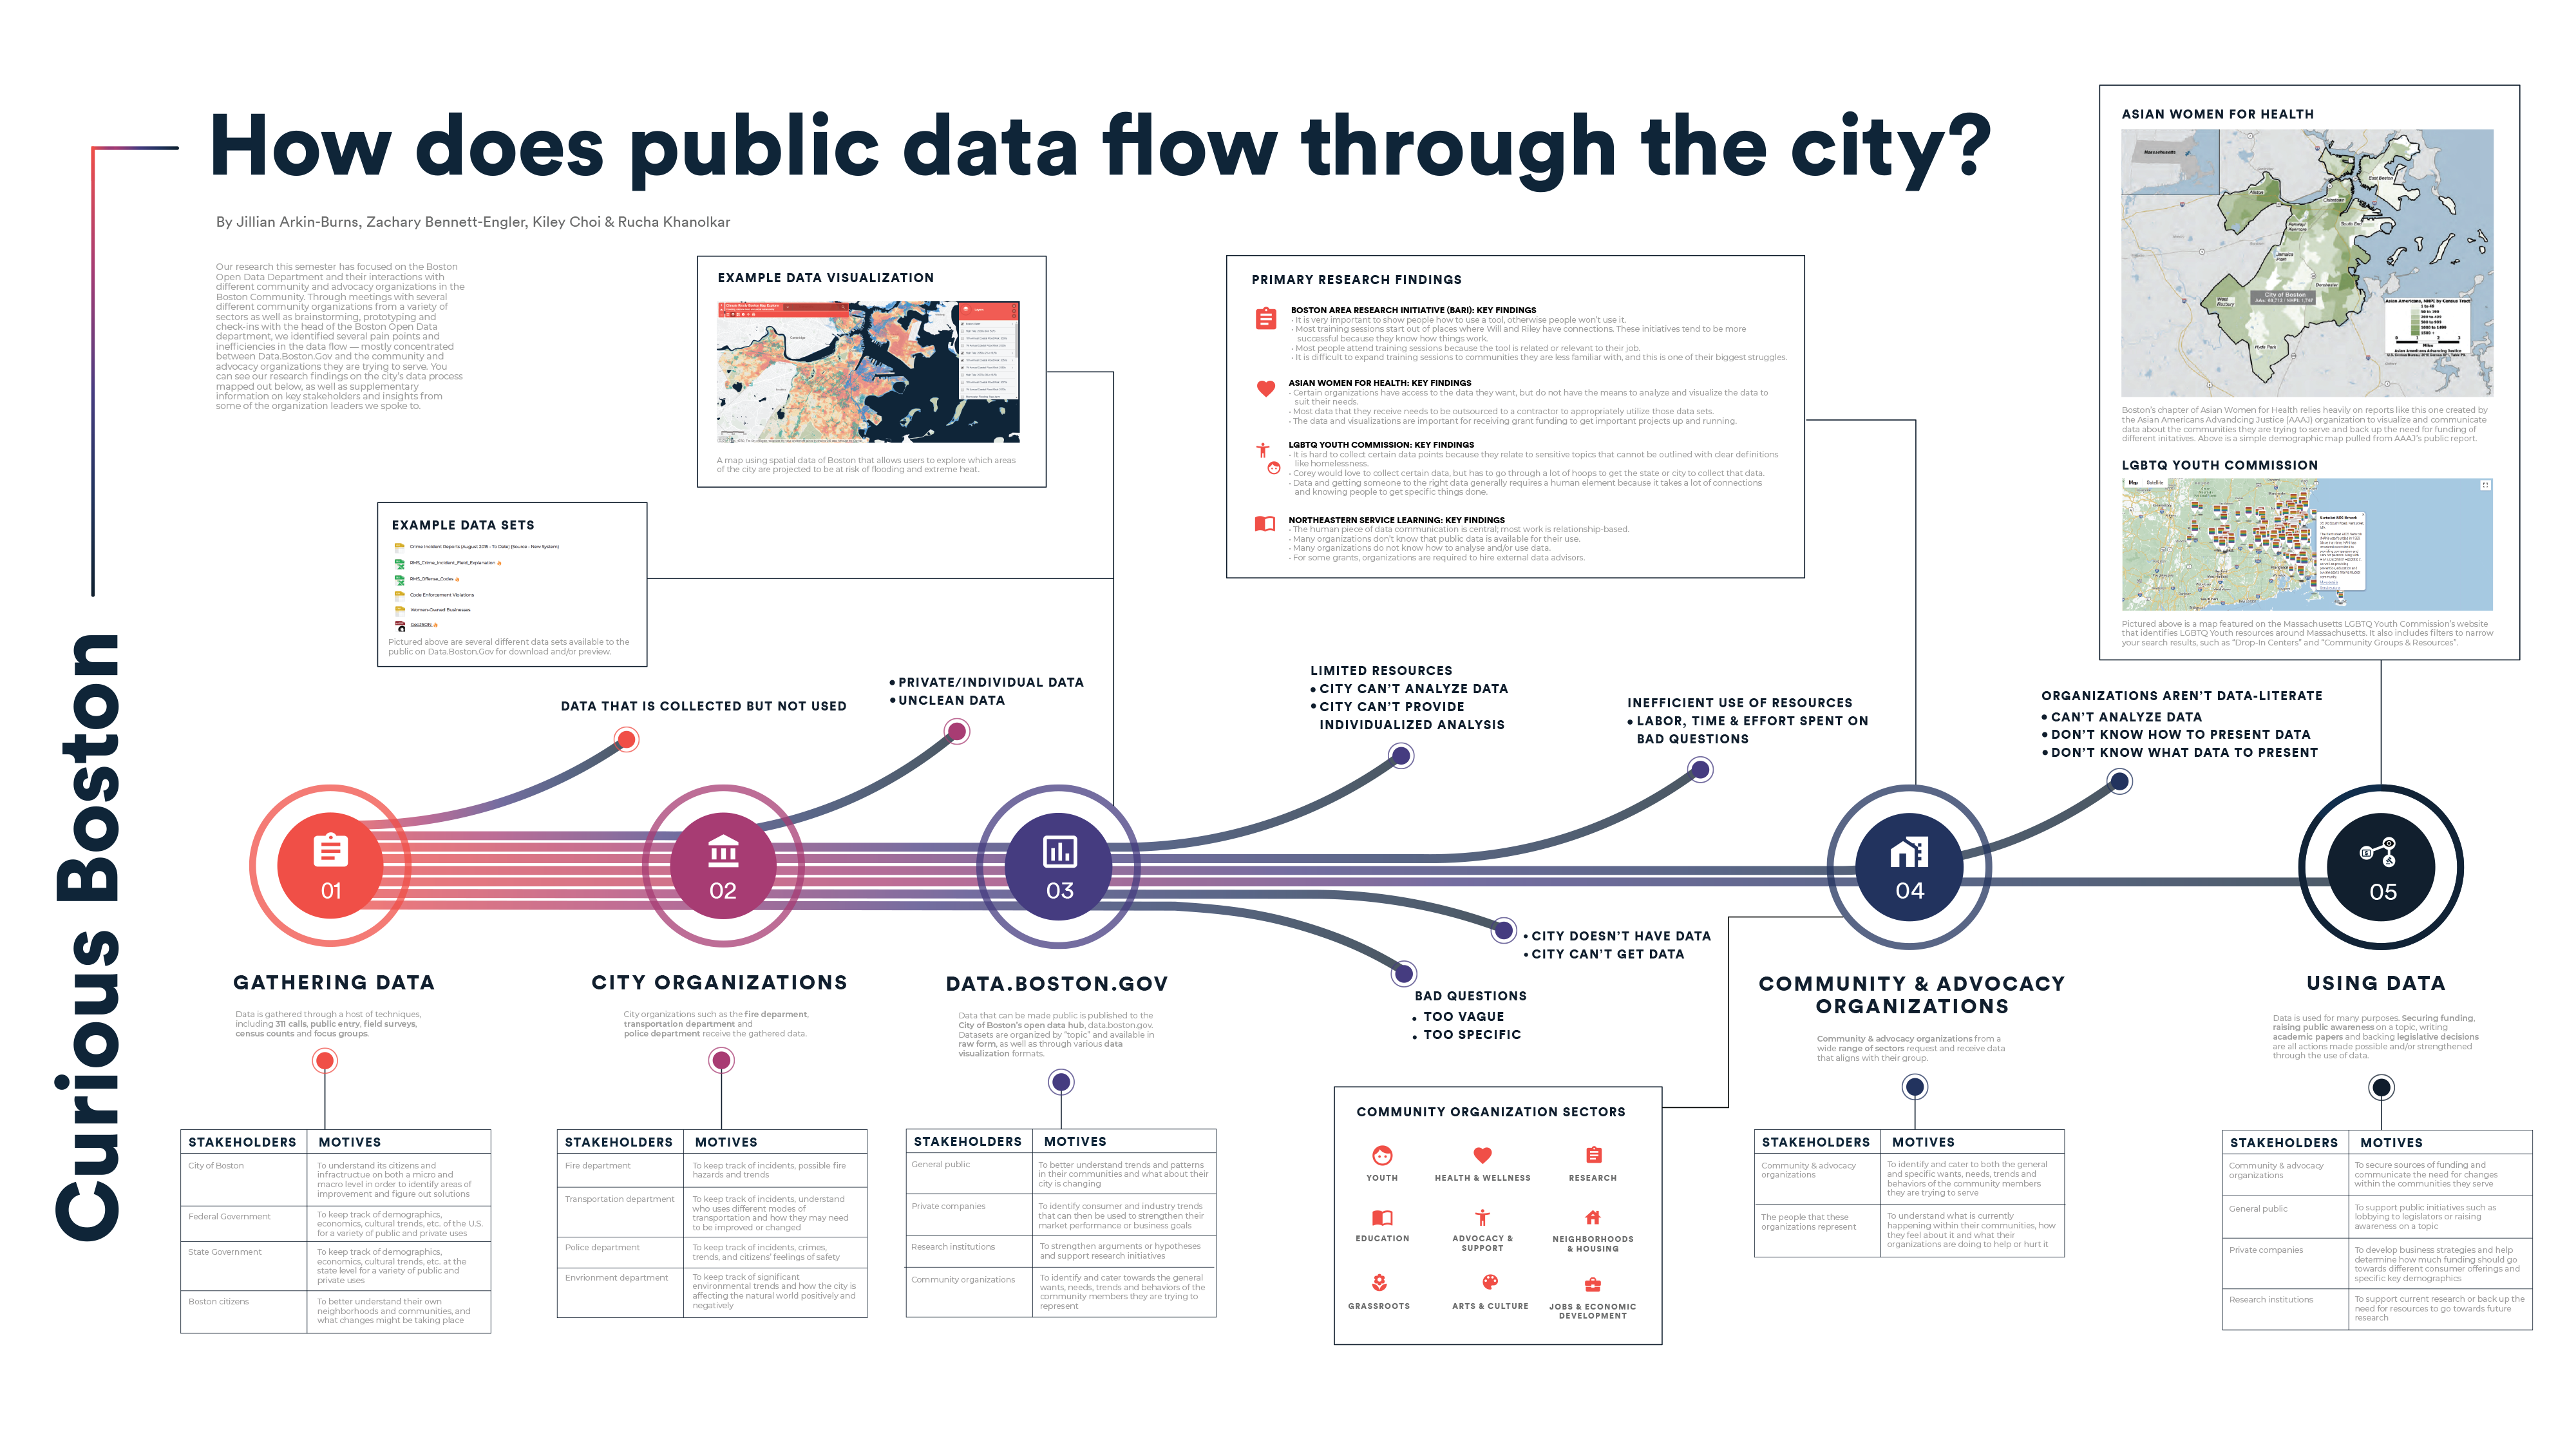
The PDF book below* details the process and outputs of my senior group capstone project, which was research-driven and exploratory in nature and took place over the last two semesters of my undergraduate degree in Interactive Media & Marketing. Our research over the Fall 2019 semester focused on the Boston Open Data Department and their interactions with different community and advocacy organizations in the Boston Community. Through meetings with several different community organizations from a variety of sectors as well as brainstorming, prototyping and check-ins with the head of the Boston Open Data department, we identified several pain points and inefficiencies in the data flow — mostly concentrated between Data.Boston.Gov and the community and advocacy organizations they are trying to serve. We brought the pain points in the process to life with a 6-foot-long “giga map”, which earned us the 2020 Data and Digital Storytelling Award at Northeastern University’s RISE Expo.
We found (1) inefficient use of resources in clarifying the data-related inquiries of individual organizations, (2) a lack of knowledge from the city regarding how public data is used by organizations, and (3) little-to-no connection or cooperation among organizations with similar data needs. Based on our findings, we designed an initial wep prototype for a new search mechanism to be added to Boston’s data portal.
Over the course of the Spring 2020 semester, we continued testing and development of this web prototype. We expanded on this work by building high-fidelity prototypes of a new data inquiry form and a new way for community organization users to showcase their data projects. To connect different organizations and explore what they were interested in about public data, we also organized and hosted a data-focused event featuring a data training session and interactive activity.
* If you are a screen-reader user and you encounter any issues with reading the embedded version of the PDF below, please try opening the direct PDF link: Curious Boston Final Process Book. If you still run into any issues, feel free to email me at kileymchoi@gmail.com so I can make sure to improve the accessibility of this page!
Impact
My impact on the project
My teammates and I worked together on most aspects of this project, including the planning & execution of multiple phases of qualitative research and the ideation & iteration behind the prototype solutions that we handed off to the Open Data Department. Although my team was very collaborative, we came from a variety of backgrounds and each focused on certain aspects of the project to play to our strengths. Beyond our collaborative work, my main focus was on the information design of our research results, and I was responsible for leading the design process and executing the final design of the 6-foot-long giga map synthesizing and communicating our findings. I was also responsible for much of the Process Book documentation and the design of our data event visuals.